Tag: Sustainability
Googlers for climate: meet Lisa Arendt
by Ralf Bremer on Aug.03, 2022, under 3D Models, Argentina, Australia, Brazil, California, Denmark, England, Germany, Google Earth News, Google Earth Tips, Google Sky, Google maps, Hawaii, Indonesia, Ireland, Italy, Japan, Kenya, Mexico, Natural Landmarks, Netherlands, Sightseeing, Street Views, USA
 Introducing just one of our colleagues who works on sustainable projects and products.
Go even greener this holiday season
by Michelle Budzyna on Dec.14, 2021, under 3D Models, Argentina, Australia, Brazil, California, Denmark, England, Germany, Google Earth News, Google Earth Tips, Google Sky, Google maps, Hawaii, Indonesia, Ireland, Italy, Japan, Kenya, Mexico, Natural Landmarks, Netherlands, Sightseeing, Street Views, USA
I’m always looking for ways to be more sustainable. And with the holidays in full swing, when many of us (✋) are particularly overindulgent, it’s a fitting time to start eco-friendlier traditions.
Here are a few ways you can embrace more green this holiday season, with help from Google.
Take the road less wasteful
Traveling for the holidays this year? It’s easy to find more sustainable ways to get where you’re going. Google Flights now shows estimated carbon emissions for every flight. And if you’re hitting the road, Google Maps lets you choose the most fuel-efficient driving route if it’s not already the fastest one. If you also need a place to crash (other than your parents’ house), a quick Google search for hotels will show you information about their sustainability efforts.

Look up estimated carbon emissions on Google Flights.
Save (your) energy
It’s tempting to keep the living room holiday lights on all night — not only because they’re festive, but so you can avoid the tangled wires to turn them off. If you connect them to your Google Nest or Home speaker or display using a compatible smart plug, you can easily turn them off with your voice, conserving energy for both you and the planet. You can also set up a Routine so they automatically turn on and off at a specific time every day. While you’re at it, save even more energy with a Home & Away Routine for your Nest thermostat to automatically adjust the heat at different points of the day, including when you’re out of the house.
Recycle the old, in with the new
After the holidays, many of us are faced with mountains of boxes, wrapping paper and, oh yes, a tree. You may also need to make space for new gifts — like the Pixel 6 or Pixel 6 Pro?
3 new ways to navigate more sustainably with Maps
by Russell Dicker on Oct.06, 2021, under 3D Models, Argentina, Australia, Brazil, California, Denmark, England, Germany, Google Earth News, Google Earth Tips, Google Sky, Google maps, Hawaii, Indonesia, Ireland, Italy, Japan, Kenya, Mexico, Natural Landmarks, Netherlands, Sightseeing, Street Views, USA
Vehicles on the road account for over 75% of transportation CO2 emissions and are one of the largest contributors of greenhouse gasses worldwide, according to the International Energy Agency. Today at our Sustainable with Google event, we’re announcing three new Google Maps updates to help lower these emissions and provide people with greener choices when getting from A to B.
Eco-friendly routing: now live
Giving you more sustainable choices with Google
by Sundar Pichai on Oct.06, 2021, under 3D Models, Argentina, Australia, Brazil, California, Denmark, England, Germany, Google Earth News, Google Earth Tips, Google Sky, Google maps, Hawaii, Indonesia, Ireland, Italy, Japan, Kenya, Mexico, Natural Landmarks, Netherlands, Sightseeing, Street Views, USA
Climate change is no longer a distant threat — it’s increasingly local and personal. Around the world, wildfires, flooding and other extreme weather continue to affect our health, our economies and our future together on our planet. We need urgent and meaningful solutions to address this pressing challenge. That’s why last year we committed to bold action to run our data centers and campuses on 24/7 carbon-free energy by 2030.
Companies aren’t the only ones asking what more we can do to help the planet — increasingly people are asking themselves those questions, too. So today we’re sharing several new ways people can use Google’s products to make sustainable choices. Among them, we’re introducing new features to book flights or purchase appliances that have lower carbon footprints, a Nest program to support clean energy from home, and eco-friendly routing on Google Maps — which is rolling out today. And when people come to Google Search with questions about climate change, we’ll show authoritative information from sources like the United Nations, in addition to the existing news sources that we currently raise up in the carousel. It’s all part of our goal to help one billion people make more sustainable choices by 2022.
You can now see carbon emissions per seat for every flight in Google Flights.
Travel and shop more sustainably
We’re adding new features to help make decisions about travel — from what flights to book to where to stay. Launching globally today, we’re bringing carbon emissions information to Google Flights. You’ll be able to see associated carbon emissions per seat for every flight, and quickly find lower-carbon options. And when you search for hotels, you’ll see information on their sustainability efforts, from waste reduction and water conservation measures to whether they’re Green Key or EarthCheck certified.
We’re also helping people make more sustainable choices when they shop, starting with home appliances. When you search for energy-intensive products like furnaces, dishwashers or water heaters, suggestions in the Shopping tab will help narrow your search to cost-effective and sustainable options.
Supporting clean energy from home
For over a decade, Nest thermostats have helped people save energy at home. Today we are taking these efforts a step further with a new service called Nest Renew. Using a feature called Energy Shift, compatible Nest thermostats can help users automatically shift electricity usage for heating and cooling to times when energy is cleaner or less expensive. For those who want to do more to help support the growth of clean energy, we will offer a paid subscription option, Renew Premium, that will match your fossil fuel electricity at home with high-quality renewable energy credits generated from the same projects in Google's energy portfolio.
Getting around more sustainably
Traveling by car is one of the more carbon-intensive choices people make on a daily basis. Starting today in the U.S., and in Europe in 2022, Google Maps will let you choose the most fuel-efficient route if it isn’t already the fastest one. We estimate that this could save over one million tons of carbon emissions per year — the equivalent of removing over 200,000 cars from the road — and save you money by reducing fuel consumption.
You can choose the most eco-friendly route in Google Maps.
We're also working to make sure the cars that remain on the road are eco-friendly. On Search, we're making it easier to see hybrid and electric vehicle options, compare them against gas-powered models, and find rebates so you know the true cost before you buy. These features will start to roll out in the U.S. this year, with more to come in 2022.
Of course, the most sustainable choice often doesn't involve a car at all. That’s why we’re introducing lite navigation for cyclists on Maps, and making it simpler to find bikes and scooter shares in over 300 cities around the world.
AI for more efficient traffic lights

Early research indicates that AI can help cities make their traffic lights more efficient, making every route more eco-friendly no matter the car.
At the same time, we’re finding ways to make routes more efficient, across an entire city, with early research into using artificial intelligence to optimize the efficiency of traffic lights. We’ve been piloting this research in Israel to predict traffic conditions and improve the timing of when traffic lights change. So far, we are seeing a 10-20% reduction in fuel consumption and delay time at intersections. We’re excited to expand these pilots to Rio de Janeiro and beyond.
Cleanest cloud in the industry
We’re also helping business customers like Whirlpool, Etsy, HSBC, Unilever and Salesforce develop new solutions for the specific climate change challenges they face, and benefit from the cleanest cloud in the industry. We recently launched tools to help businesses choose cleaner regions to locate their Google Cloud resources. And next week at Google Cloud Next ‘21, we’ll announce more ways every company can choose to be more sustainable.
More sustainable with Google
In all these efforts, our goal is to make the sustainable choice an easier choice. At the individual level, these choices may seem small, but when people have the tools to make them at scale, they equal big improvements. We’ll need nothing less to avert the worst consequences of climate change, and we’ll continue to find ways our products can help.
Te ofrecemos más opciones sustentables con Google
by Sundar Pichai on Oct.06, 2021, under 3D Models, Argentina, Australia, Brazil, California, Denmark, England, Germany, Google Earth News, Google Earth Tips, Google Sky, Google maps, Hawaii, Indonesia, Ireland, Italy, Japan, Kenya, Mexico, Natural Landmarks, Netherlands, Sightseeing, Street Views, USA
El cambio climático ya no es una amenaza lejana, sino algo cada vez más local y personal. En todo el mundo, los incendios forestales, las inundaciones y otras condiciones climáticas afectan nuestra salud, nuestras economías y nuestro futuro juntos en el planeta. Necesitamos soluciones urgentes y significativas para abordar este desafío apremiante. Es por eso que el año pasado nos comprometimos a alcanzar, para el año 2030, el ambicioso objetivo de operar nuestros campus y centros de datos con energía libre de carbono de forma permanente.
Las empresas no son las únicas que se preguntan qué más podemos hacer para ayudar al planeta; cada vez más, las personas también se hacen esas preguntas. Por eso, hoy compartimos varias maneras nuevas en las que las personas pueden usar los productos de Google para tomar decisiones sustentables. Entre ellas, presentamos nuevas funciones para reservar vuelos o comprar electrodomésticos que tienen una huella de carbono más baja, un programa de Nest para apoyar la energía limpia en el hogar y nuevas rutas ecológicas en Google Maps, que comienzan a implementarse hoy. Y cuando las personas acudan a la Búsqueda de Google con preguntas sobre el cambio climático, mostraremos información fidedigna de fuentes como las Naciones Unidas, además de las fuentes de noticias existentes que actualmente presentamos en los resultados. Estos esfuerzos forman parte de nuestro objetivo de ayudar a mil millones de personas a tomar decisiones más sustentables para 2022.
Ahora se podrán ver las emisiones de carbono por asiento para cada vuelo en Google Flights.
Viaja y compra de manera más sustentable
Estamos agregando nuevas herramientas para ayudar a tomar decisiones sobre viajes: desde qué vuelos reservar hasta dónde hospedarse. Con un lanzamiento global, ahora incluímos información sobre emisiones de carbono en Google Flights. Podrás ver las emisiones de carbono asociadas por asiento a cada vuelo y encontrar al instante opciones con menos emisiones. Y cuando busques hoteles, verás información sobre los esfuerzos de sustentabilidad, desde la reducción de desechos y las medidas de conservación del agua hasta las certificaciones Green Key o EarthCheck obtenidas.
También ayudamos a las personas a tomar decisiones más sustentables cuando compran, comenzando por los electrodomésticos. Cuando busques productos que consuman mucha energía, como hornos, lavavajillas o calentadores de agua, las sugerencias en la pestaña Compras te ayudarán a limitar la búsqueda a opciones rentables y sustentables.
Apoyando la energía limpia en el hogar
Desde hace más de una década, los termostatos Nest ayudan a ahorrar energía en casa. Hoy damos un paso más conun nuevo servicio llamado Nest Renew. Con una función llamada Energy Shift, los termostatos Nest compatibles pueden ayudar a los usuarios a cambiar automáticamente el uso de electricidad para calefacción y enfriamiento a los momentos en los que la energía es más limpia o menos costosa. Para aquellos que quieran ayudar más a apoyar el crecimiento de la energía limpia, ofrecemos una opción de suscripción paga, Renew Premium, que igualará el consumo estimado de electricidad de combustibles fósiles de los usuarios en el hogar con créditos de energía renovable generados a partir de plantas solares y eólicas de EE.UU.
Nos movemos con mayor sustentabilidad
Viajar en auto es una de las decisiones con mayor generación de carbono que las personas toman a diario. A partir de hoy en EE.UU., y en Europa en 2022, Google Maps te permitirá elegir la ruta con menor cantidad de emisiones de carbono, en el caso que no sea la ruta más rápida. Estimamos que esto podría ahorrar más de un millón de toneladas de emisiones de carbono por año, el equivalente a retirar más de 200,000 automóviles de la carretera, además de permitir a los usuarios ahorrar dinero gracias a la reducción del consumo de combustible.
Puedes escoger la ruta con menor emisiones de carbono en Google Maps.
También estamos trabajando para asegurarnos que los autos que permanezcan en la carretera sean ecológicos. En la Búsqueda de Google, estamos haciendo que sea más sencillo ver las opciones de vehículos híbridos y eléctricos, compararlas con los modelos a gasolina y encontrar descuentos para que sepas el costo real antes de comprar. Estas funciones se lanzarán en EE.UU. este año, y habrá más en 2022.
Por supuesto que, a menudo, la opción más sustentable simplemente no involucra al automóvil. Es por eso que presentamos funciones de navegación más sencillas para los ciclistas en Maps y facilitamos la búsqueda de bicicletas y scooters compartidos en más de 300 ciudades de todo el mundo.
Inteligencia artificial para semáforos más eficientes
Las primeras investigaciones indican que la inteligencia artificial puede ayudar a las ciudades a hacer que sus semáforos sean más eficientes haciendo que cada ruta sea más ecológica, sin importar el medio de transporte.
Al mismo tiempo, buscamos formas de hacer que las rutas sean más eficientes en toda una ciudad, con investigaciones iniciales donde se utiliza inteligencia artificial para optimizar la eficiencia de los semáforos. Pusimos a prueba esta investigación en Israel para predecir las condiciones de tráfico y mejorar los tiempos en los que cambian las luces de los semáforos, y observamos una reducción de entre el 10% y el 20% en el combustible y el tiempo de demora en las intersecciones. Nos entusiasma el potencial de estas pruebas y estamos en conversaciones para expandirnos a Río de Janeiro y otras ciudades.
La nube más limpia de la industria
Aparte de a los individuos, ayudamos a clientes empresariales como Whirlpool, Etsy, HSBC, Unilever y Salesforce a desarrollar nuevas soluciones en función de los desafíos específicos del cambio climático que enfrentan, de modo que puedan beneficiarse con la nube más limpia de la industria. Hace poco, lanzamos herramientas para ayudar a las empresas a elegir regiones más limpias donde ubicar sus recursos de Google Cloud. Y la próxima semana, en Google Cloud Next '21, anunciaremos más formas en las que cada empresa puede construir un futuro más sustentable.
Más sustentabilidad con Google
En todos estos esfuerzos, nuestro objetivo es hacer que la opción sustentable sea una elección más fácil. En el nivel individual, estas opciones pueden parecer pequeñas, pero cuando las multiplicas en todos nuestros productos, equivalen a grandes mejoras. Necesitaremos eso y más para prevenir las peores consecuencias del cambio climático. Seguiremos trabajando para generar formas en las que nuestros productos puedan ayudar.
How 5 cities plan to use Tree Canopy to fight climate change
by Ruth Alcantara on Sep.30, 2021, under 3D Models, Argentina, Australia, Brazil, California, Denmark, England, Germany, Google Earth News, Google Earth Tips, Google Sky, Google maps, Hawaii, Indonesia, Ireland, Italy, Japan, Kenya, Mexico, Natural Landmarks, Netherlands, Sightseeing, Street Views, USA
Planting trees in cities helps provide shade, lower temperatures and contribute to cleaner air — all of which are huge benefits when it comes to adapting to the effects of climate change. That’s why we’re expanding our Environmental Insights Explorer Tree Canopy insights to more than 100 cities around the world next year, helping local governments fight climate change. We chatted with city officials in Los Angeles, Louisville, Chicago, Austin and Miami to learn more about how they plan to use Tree Canopy insights to build thriving, sustainable cities in 2021 and beyond.
Los Angeles
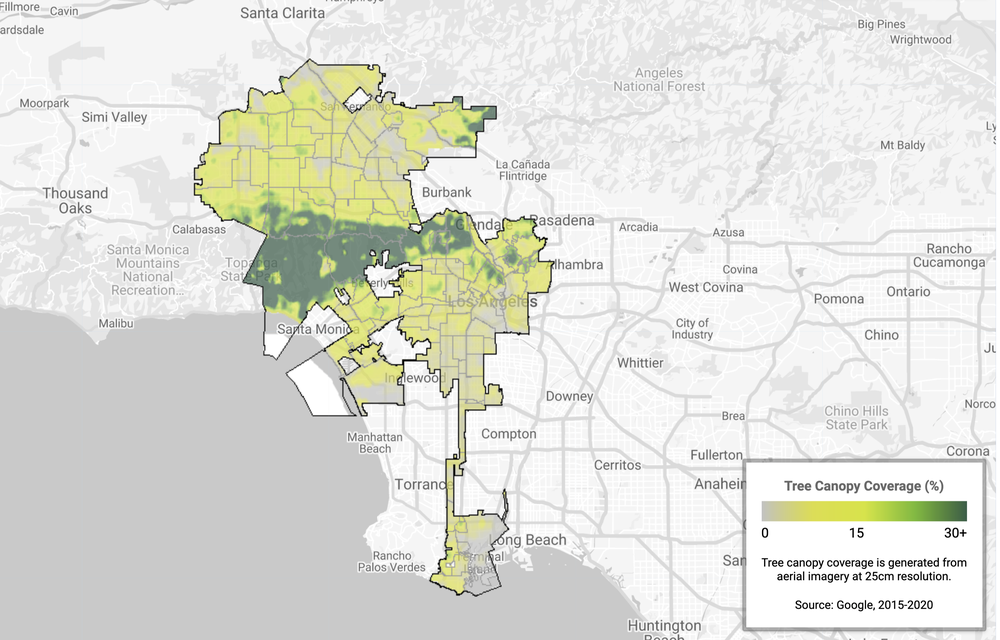
Tree canopy coverage in Los Angeles
Los Angeles was the first city to pilot Tree Canopy Insights. Since then it’s become an essential part of the city’s goal to increase tree canopy coverage by 50% by 2028 in areas of the city with the highest need. The city is working to plant 90,000 trees this year, and Tree Canopy Insights helps them prioritize which neighborhoods need tree shade the most.Rachel Malarich, Los Angeles’ City Forest Officer, and her team use Tree Canopy Insights alongside their inventory system to look at canopy acreage projections, current canopy cover and temperatures. The land use types within the tool allows them to consider the type of outreach needed and opportunities that exist in a given neighborhood. Most importantly, it helps Rachel and her team know which program initiatives are working and which aren’t.
“Tree Canopy Insights’ ability to give us timely feedback allows me to have data to make arguments for changes to the City's policies and procedures, as well as potentially see the impact of different outreach activities going forward.” - Rachel Malarich, Los Angeles City Forest Officer
Louisville
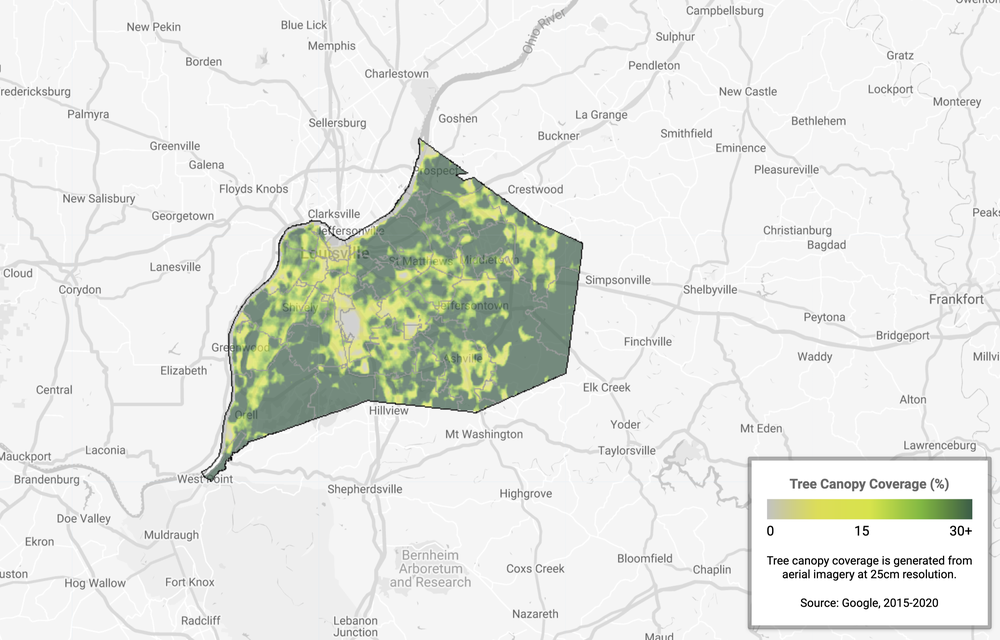
Tree canopy coverage in Louisville
Similar to other cities, Louisville officials found that monitoring tree coverage on their own was hugely expensive and time intensive. Sometimes it took years to get the accurate, up-to-date data needed to make decisions.
With Tree Canopy Insights, they’ve been able to glean actionable insights about tree cover faster. In just a few weeks, they’ve pinpointed that the west side of town was losing tree shade at an unprecedented rate and jump started a plan to plant more trees in the area.
“Planting trees is one of the simplest ways we can reduce the impacts and slow the progress of climate change on our city. With support from Google’s Tree Canopy Insights, Louisville can enhance its ongoing surveillance of hot spots and heat islands and understand the impact of land use and development patterns on tree canopy coverage.“ – Louisville Mayor Greg Fischer
Austin
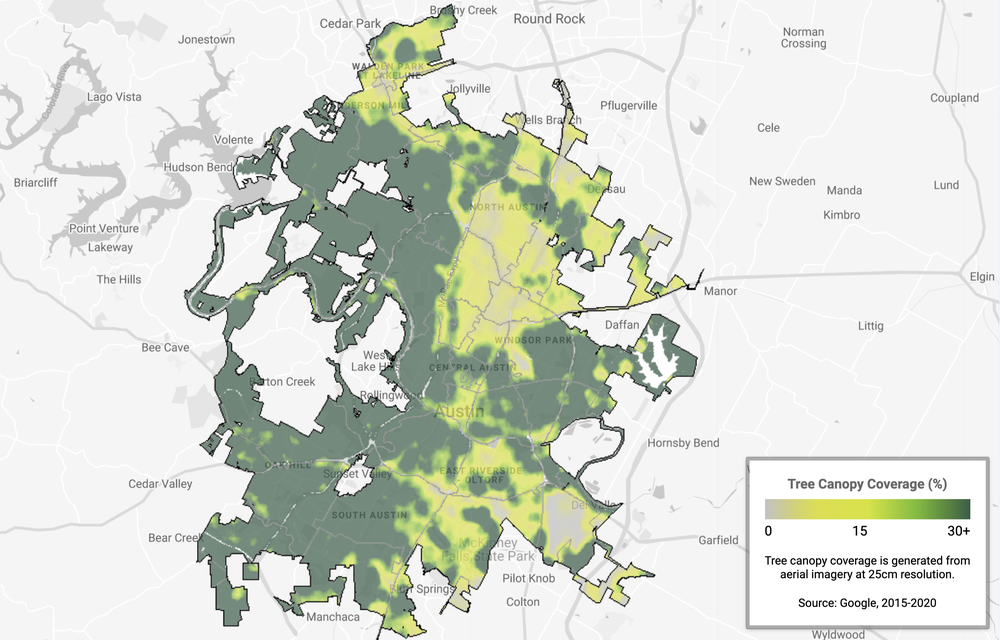
Tree canopy coverage in Austin
Austin’s summers are hot with the heat regularly reaching over 90 degrees. Using Tree Canopy Insights, Marc Coudert, an environmental program manager for the city, noticed a troubling trend: ambient temperatures were higher in the eastern part of the city, known as the Eastern Crescent. With these insights, Marc and the City’s forestry team developed Austin’s Community Tree Priority Map and doubled down on planting trees in neighborhoods in the Eastern Crescent to make sure there was equitable tree canopy coverage across the city.
“At the city of Austin, we’re committed to making data-backed decisions that bring equity to all of our communities. Google’s Tree Canopy Insights empowers us to do exactly that.” - Austin Mayor Steve Adler
Chicago
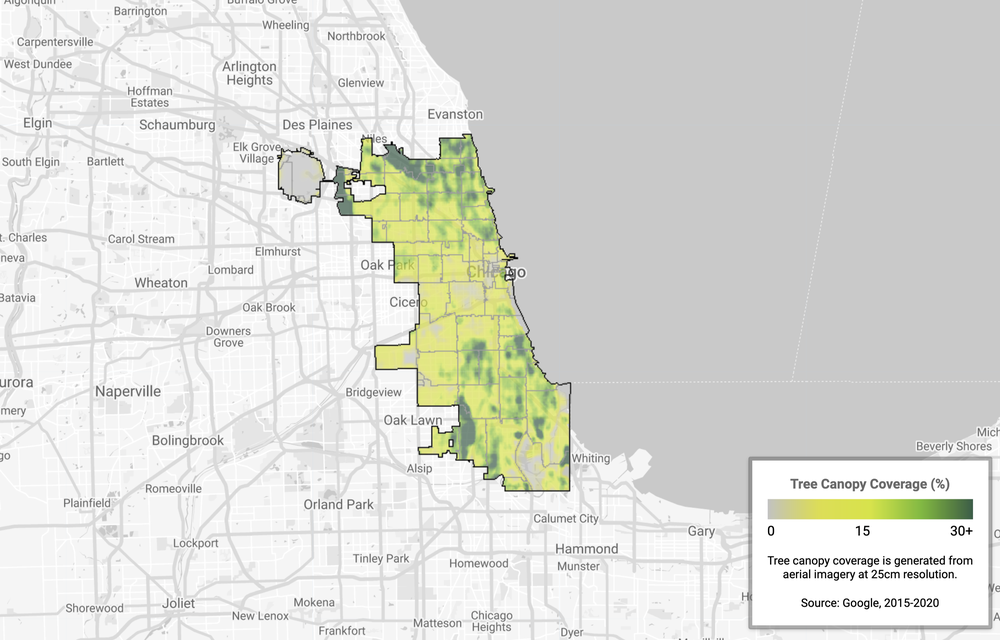
Tree canopy coverage in Chicago
Chicago’s Department of Public Health understands that planting trees is an essential part of promoting health and racial equity. After all, a lack of trees can be associated with chronic diseases like asthma, heart disease and mental health conditions. With Tree Canopy Insights, the department discovered that their hottest neighborhoods are often also the most disadvantaged — making these communities extremely vulnerable. With the use of this tool, the City of Chicago is committed to focusing their tree planting efforts specifically on these high-risk areas.
"Trees not only provide our city with shade, green spaces and beauty, but they are also precious resources that produce clean air — making them key to shaping our sustainable future. Through this partnership with Google, our sustainability and public health teams will have access to real-time insights on our tree coverage that will inform how we develop and execute our equitable approach to building a better Chicago landscape. I look forward to seeing how this technology uses our city's natural resources to benefit all of our residents." - Chicago Mayor Lori E. Lightfoot.
Miami
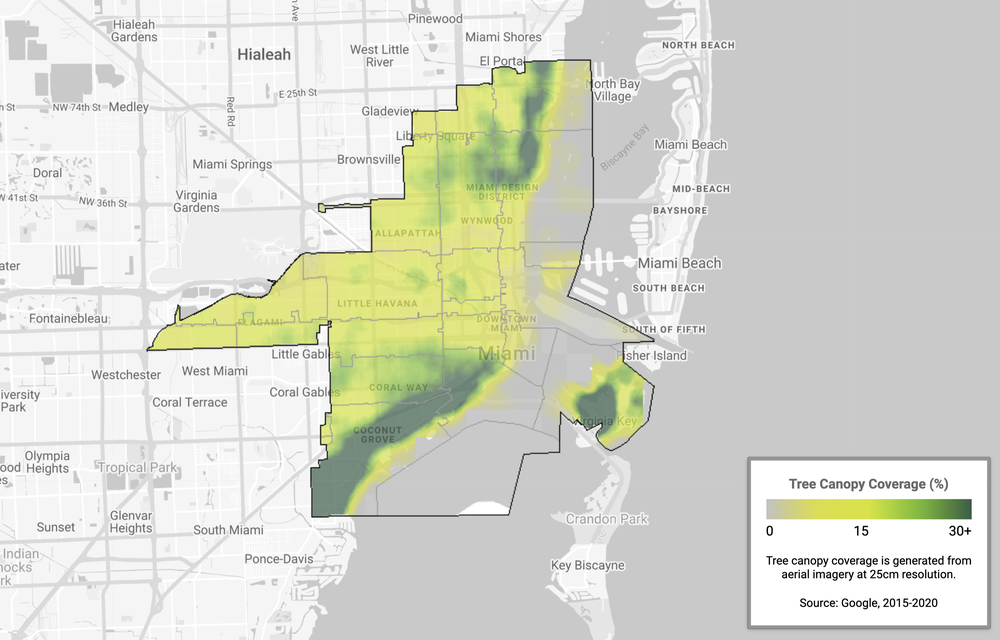
Tree canopy coverage in Miami
Miami gets over 60 inches of rain per year, leading to potentially devastating effects from flooding and infrastructure damage. To address this, the city recently launched their Stormwater Master Plan. The multi-year initiative has already resulted in over 4,000 trees planted, translating to an additional 400,000 gallons of water absorption capacity per day. Moving forward, the city plans to use Tree Canopy Insights to evolve and improve this plan.
“Google’s Tree Canopy Insights is going to help us build on the progress of our Stormwater Master Plan in smarter, more effective ways. We believe that every city needs to be a “tech city,” and leveraging Google’s AI capabilities to improve every Miamians quality of life is exactly what I mean by that.” – Miami Mayor Francis Suarez
If you’re part of a local government and think Tree Canopy Insights could help your community, please get in touch with our team by filling out this form.A marine biologist uses Maps to explore under the sea
by Alicia Cormie on Jun.08, 2021, under 3D Models, Argentina, Australia, Brazil, California, Denmark, England, Germany, Google Earth News, Google Earth Tips, Google Sky, Google maps, Hawaii, Indonesia, Ireland, Italy, Japan, Kenya, Mexico, Natural Landmarks, Netherlands, Sightseeing, Street Views, USA
Just under the water lies one of the biggest mysteries of the Great Barrier Reef: blue holes. These underwater sinkholes give researchers a rare look at ocean life and how we can protect it. Until a few years ago, only two blue holes were documented in the entirety of the Great Barrier Reef — they are hard to find and even harder to get to.
With the help of Google Maps, marine biologist Johnny Gaskell and a team of researchers are finding previously unknown blue holes. In 2017, after witnessing Cyclone Debbie destroy many of the reefs in its path, he set out to find more blue holes. Home to hundreds of species of coral and serving as a protective waters for larger marine life, these formations give scientists a view of history buried in undisturbed sediment layers and clues about how to better protect coral reefs.
Using Google Maps’ satellite view, Johnny followed the cyclone’s path to pinpoint areas along the reef that might have been spared from damage. That’s when he spotted perfect circles along the reef, indicating a potential blue hole. The formation he identified was south of the Whitsundays in the Hard Line Reefs, a difficult-to-reach area of the Great Barrier Reef that’s dangerous to navigate. Despite this, Johnny and a team of divers headed out into the unknown, unsure of what — if anything — awaited them.
There’s still so many spots out in the Great Barrier Reef that are unexplored.
With the satellite view of Google Maps on their phones, they navigated their boats through narrow channels in unsurveyed waters until the blue dot on their map was directly over the blue hole. Johnny dove in and found healthy coral formations that have sat undisturbed, possibly for centuries. Along the edges were delicate birdsnest corals, vibrant giant clams and huge branching staghorn corals. In the stillness of the blue hole’s center, there were green sea turtles, giant trevally and sharks that all called the dark, cool water home.
With the help of Google Maps, a discovery that would have taken years of underwater exploration on the seafloor is now allowing researchers to expand our understanding of the world’s largest ecosystem. Today, Johnny is still working to build a snapshot of coral reef conditions. Working with Citizens of the Great Barrier Reef and the Great Reef Census project, they are using geotagged images to give everyone — from scientists to students — a better idea of what’s going in depths of the water whether they dive in or not.
In 2021 the Great Reef Census is expanding to reach more reefs, collect more data, and broaden its research goals. To join the efforts, sign up as a Citizen or contribute directly via the project’s fundraising page.
Street by street: How we’re mapping air quality in Europe
by Karin Tuxen-Bettman on May.26, 2021, under 3D Models, Argentina, Australia, Brazil, California, Denmark, England, Germany, Google Earth News, Google Earth Tips, Google Sky, Google maps, Hawaii, Indonesia, Ireland, Italy, Japan, Kenya, Mexico, Natural Landmarks, Netherlands, Sightseeing, Street Views, USA
Since 2015, dozens of Street View cars outfitted with pollution sensors have been cruising the roads to track air quality in cities all over the world — from Oakland to Sydney. Over the past six years, these cars have collected more than 100 million street-by-street air quality measurements, all for Project Air View — our effort to bring detailed air quality maps to scientists, policymakers and everyday people. These hyperlocal air quality measurements are helping governments and communities make more informed choices about changes that can help city residents breathe cleaner air.
In celebration of EU Green Week next week,we are sharing a new air quality map for Copenhagen and recently started working with the City of Dublin to collect air quality measurements with Aclima technology in our first-ever, all-electric Street View car. This is all part of Google’s Environmental Insights Explorer (EIE), our free tool that provides thousands of cities with actionable data and insights to reduce their emissions.
Capturing air quality in Copenhagen
In 2018, we started mapping hyperlocal air quality in Copenhagen, working closely with the City of Copenhagen and Utrecht University, in collaboration with Aarhus University. The map — which is already being put to use — includes measurements of nitrogen dioxide (NO2), black carbon, and ultrafine particles. Through mapping street-by-street air quality we found that Copenhagen’s major access roads have nearly three times more ultrafine particles and nitrogen dioxide (NO2) and five times higher black carbon levels when compared to less trafficked residential areas.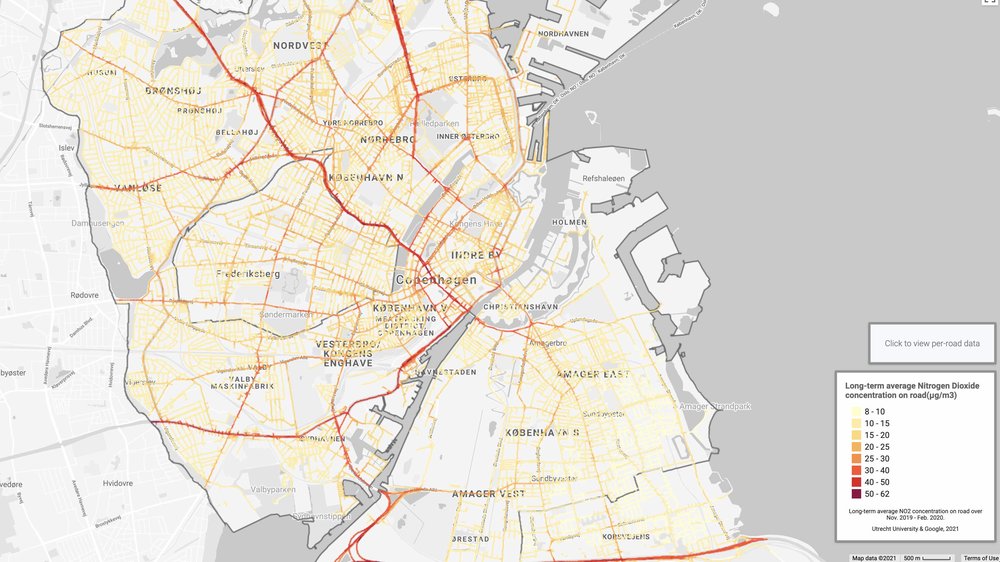
This air quality map shows the street-by-street average of nitrogen dioxide (NO2). Utrecht University & Google, 2021.
Armed with these air quality insights, the City of Copenhagen and urban planners are working to design future neighborhoods that include “Thrive Zones.” These zones aim to build places, like schools and playgrounds, away from high-pollution zones to provide young children with access to cleaner air. The city also plans to use the air quality data to encourage more sustainable transportation and create healthier bicycle and walking routes away from car traffic.
An all-electric Street View car hits the road in Dublin
We’ve also partnered with the City of Dublin to gather hyperlocal air quality measurements in Ireland’s capital, where our first all-electric Street View vehicle, a Jaguar I-PACE, has hit the roads. This is the first time an all-electric Google Street View car is being used to capture air pollution and greenhouse gas measurements and Google Street View imagery — a feat made possible due to Jaguar Land Rover engineers integrating Google's Street View technology and specialized Aclima sensors into the vehicle.
Our Jaguar I-PACE is able to measure nitrogen dioxide (NO2), nitric oxide (NO), carbon dioxide (CO2), carbon monoxide (CO), fine particulate matter (PM2.5), and ozone (O3). Aclima’s platform analyzes and quality assures pollution measurements to develop these maps.
The road ahead
Project Air View’s air quality insights will be integrated into the European Commission-funded European Expanse project, which is exploring how pollution is impacting the health of Europeans and how hyperlocal air quality measurement efforts can inform policy development.
We also plan to equip more Street View cars with air quality mapping capabilities so that we can continue sharing hyperlocal air quality insights. By mapping air quality in more cities, we can equip people with the information they need to create more sustainable cities that protect the health of everyone.
3 ways to find and support eco-friendly places on Maps
by Izzy Parkinson on Apr.22, 2021, under 3D Models, Argentina, Australia, Brazil, California, Denmark, England, Germany, Google Earth News, Google Earth Tips, Google Sky, Google maps, Hawaii, Indonesia, Ireland, Italy, Japan, Kenya, Mexico, Natural Landmarks, Netherlands, Sightseeing, Street Views, USA
In an effort to be more eco-friendly, we all know that it’s best to reduce, reuse and recycle — and to support businesses and places that do the same. But it’s not always easy to know which restaurants compost or where you can recycle items, like electronics or clothing. Thankfully, Google Maps and its community of contributors are making it easier for everyone to make choices that are better for the planet.
As an active member of the Local Guides program, a global community of people who share their local knowledge and recommendations on Google Maps, Karol helps people find environmentally-friendly spots in her hometown of Posadas, Argentina.
“Posadas is truly a blessed place surrounded by nature, but it breaks my heart that it’s just taking its first steps on the path to being environmentally-friendly,” says Karol, who used the list featureon Maps to curate and share hard-to-find recycling centers in her city. “Anything that can be done to promote sustainable consumption is priceless.”
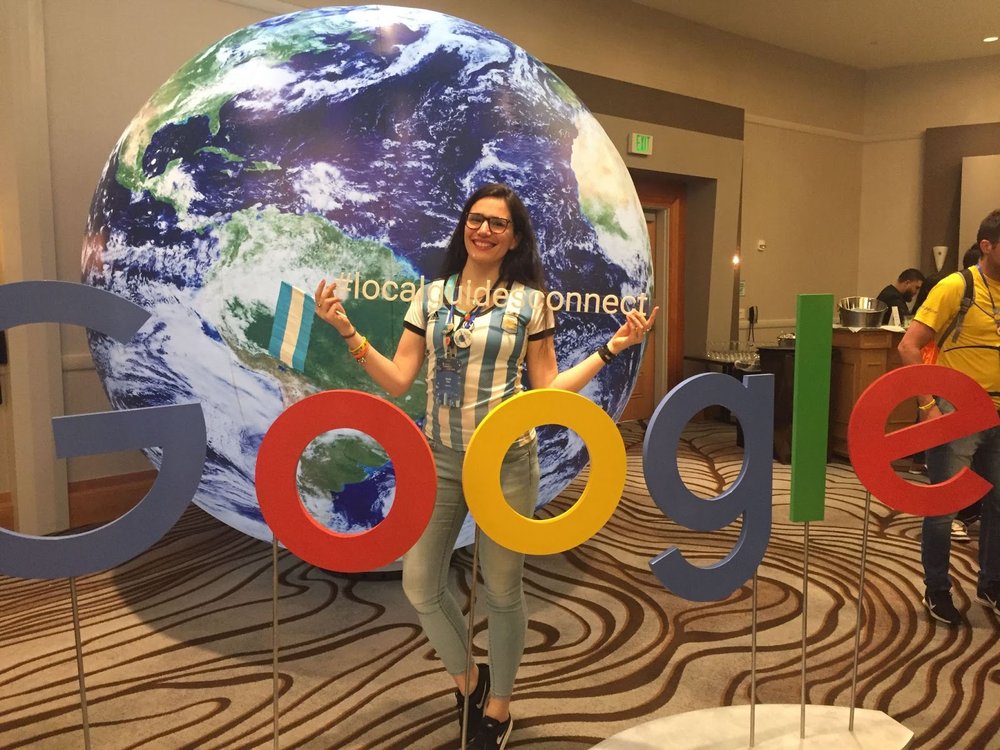
A photo of Karol at Connect Live in 2019.
Karol is no stranger to connecting people who care about the planet to the local places that do too. Here are three tips she has for finding and supporting places on Google Maps that are focused on reducing waste, reusing items and recycling materials.
Creating new tree shade with the power of AI and aerial imagery
by Nicole Lombardo on Nov.19, 2020, under 3D Models, Argentina, Australia, Brazil, California, Denmark, England, Germany, Google Earth, Google Earth News, Google Earth Tips, Google Sky, Google maps, Hawaii, Indonesia, Ireland, Italy, Japan, Kenya, Mexico, Natural Landmarks, Netherlands, Sightseeing, Street Views, USA
Most of us have heard the timeless proverb, "The best time to plant a tree was 20 years ago. The second best time is now.” Worldwide, there is growing discussion in cities about planting more trees as policymakers and neighbors look to increase shade on warming city streets.
Extreme temperatures are becoming more common in cities where concrete and infrastructure are now creating heat islands—areas that experience higher temperatures, leading to poor air quality, dehydration and other public health concerns. Trees are increasingly seen as a solution to both lowering street-level temperatures while improving quality of life. Yet many cities may not have the budget or resources to locate where every tree in town is, or where new tree-planting efforts are most needed.
With our new Tree Canopy Lab we are combining AI and aerial imagery to help cities see their current tree canopy coverage and plan future tree planting projects, starting with the City of Los Angeles.
With the Tree Canopy Lab you can see Los Angeles’s trees with local context, like what percentage of a neighborhood has leafy cover, an area’s population density, what areas are vulnerable to extreme heat, and which neighborhood councils can help get new roots in the ground.
Tree Canopy lab is in our Environmental Insights Explorer platform, a tool that makes it easier for cities to measure, plan and reduce carbon emissions and pollution. It’s also one step forward in part our commitment to help hundreds of local governments fight climate change.
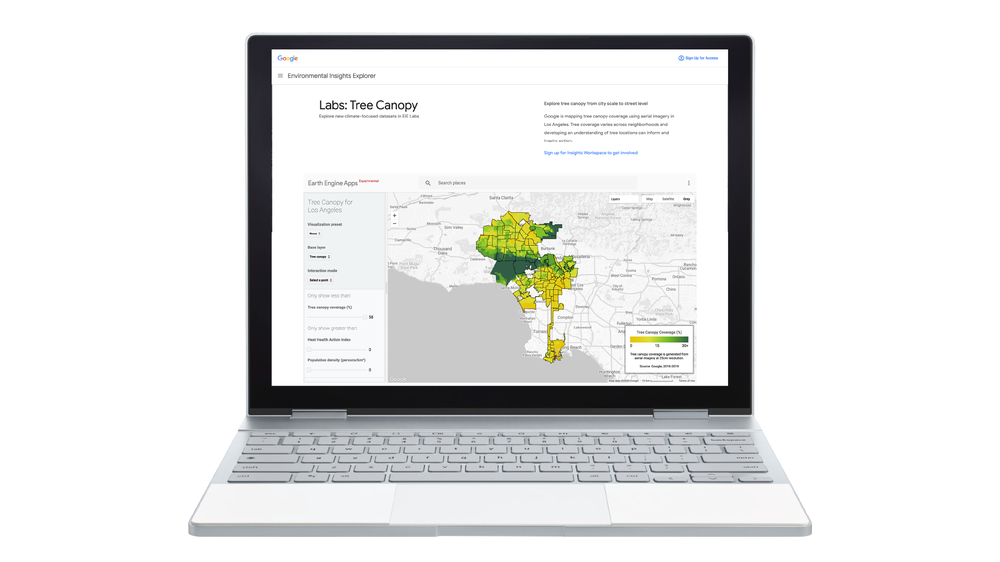
Anyone can access the Tree Canopy Lab from a tablet or personal computer
Mapping tree cover to seed new urban forestry efforts
With aerial imagery collected from planes during the spring, summer and fall seasons, as well as Google AI and Google Earth Engine’s data analysis capabilities, we can now pinpoint all the trees in a city and measure their density. The imagery we use for these calculations includes color photos that closely represent how we would see a city from the sky. To get even more detailed information about the city’s canopy cover, near-infrared photos detect colors and details that human eyes can’t see and compare images from different angles to create a height map.

See tree cover in Los Angeles with Tree Canopy Lab
We then use a specialized tree-detection AI that automatically scans the images, detects the presence of trees and then produces a map that shows the density of tree cover, also known as “tree canopy.”
With this tool, the City of Los Angeles doesn’t have to rely on expensive and time-intensive manual tree studies which can involve block-by-block tree surveys, outdated records, or incomplete studies which only count trees in public spaces.
From policymakers to neighbors, anyone can explore Los Angeles in the Tree Canopy Lab and glean insights. For example, the lab can help anyone identify residential blocks with high tree planting potential and locate sidewalks that are vulnerable to higher temperatures due to low canopy coverage.

Tree Canopy Lab's AI scans aerial images, detects the presence of trees and then produces a map that shows the density of tree cover
With Tree Canopy Lab we’ve found that more than 50 percent of Angelenos live in areas with less than 10 percent tree canopy coverage and 44 percent of Angelenos live in areas with extreme heat risk. We also see a correlation that shows parts of Los Angeles with the lowest heat risk also have the highest tree canopy coverage — these areas are also the lowest population density of Angelenos.
Connecting cities with new environmental insights
Los Angeles has been on the forefront of cities using urban forestry to not only advance sustainability goals, but to beautify neighborhoods, improve air quality and bring down street-level temperatures as the region gets hotter due to climate change.
With a near-term goal of planting and maintaining 90,000 trees by 2021 and continuing to plant trees at a rate of 20,000 per year across a city of more than 503 square miles, the Tree Canopy Lab is already helping people across the city reach this goal. From neighbors and community organizations to Mayor Eric Garcetti and the city’s first-ever forestry officer, Rachel Malarich, they all have access to a birds-eye view of where the city’s existing trees are and which areas need more greenery.
“Every tree we plant can help stem the tide of the climate crisis, and when we expand our urban forest, we can sow the seeds of a healthier, more sustainable and equitable future for communities hit hardest by rising temperatures and intensifying heat waves. Google’s technology will help us bring the power of trees to families and households across Los Angeles -- adding greenery to our public spaces, injecting beauty into our city, and bringing cooler temperatures to our neighborhoods.”
-Mayor of Los Angeles, Eric Garcetti
More tree insights for more cities on the horizon
We’ll be making the insights in Tree Canopy Lab available to hundreds of more cities in the year to come as we continue to support the ambitious work cities like Los Angeles are doing to embark on tree planting and maintenance initiatives.
We invite city planners and policymakers to reach out to kickstart a conversation with us sharing their interest through this form.
Looking for something?
Use the form below to search the site:
Still not finding what you're looking for? Drop a comment on a post or contact us so we can take care of it!
Visit our friends!
A few highly recommended friends...
Archives
All entries, chronologically...