Tag: Sustainability
Rachel Malarich is planting a better future, tree by tree
by Alicia Cormie on Nov.19, 2020, under 3D Models, Argentina, Australia, Brazil, California, Denmark, England, Germany, Google Earth, Google Earth News, Google Earth Tips, Google Sky, Google maps, Hawaii, Indonesia, Ireland, Italy, Japan, Kenya, Mexico, Natural Landmarks, Netherlands, Sightseeing, Street Views, USA
Everyone has a tree story, Rachel Malarich says—and one of hers takes place on the limbs of a eucalyptus tree. Rachel and her cousins spent summers in central California climbing the 100-foot tall trees and hanging out between the waxy blue leaves—an experience she remembers as awe-inspiring.
Now, as Los Angeles first-ever City Forest Officer, Rachel’s work is shaping the tree stories that Angelenos will tell. “I want our communities to go to public spaces and feel that sense of awe,” she says. “That feeling that something was there before them, and it will be there after them...we have to bring that to our cities.”
Part of Rachel’s job is to help the City of Los Angeles reach an ambitious goal: to plant and maintain 90,000 trees by the end of 2021 and to keep planting trees at a rate of 20,000 per year after that. This goal is about more than planting trees, though: It’s about planting the seeds for social, economic and environmental equity. These trees, Rachel says, will help advance citywide sustainability and climate goals, beautify neighborhoods, improve air quality and create shade to combat rising street-level temperatures.
To make sure every tree has the most impact, Rachel and the City of Los Angeles use Tree Canopy Lab, a tool they helped build with Google that uses AI and aerial imagery to understand current tree cover density, also known as “tree canopy,” right down to street-level data. Tree inventory data, which is typically collected through on-site assessments, helps city officials know where to invest resources for maintaining, preserving and planting trees. It also helps pinpoint where new trees should be planted. In the case of LA, there was a strong correlation between a lack of tree coverage and the city's underserved communities.
With Tree Canopy Lab, Rachel and her team overlay data, such as population density and land use data, to understand what’s happening within the 500 square miles of the city and understand where new trees will have the biggest impact on a community. It helps them answer questions like: Where are highly populated residential areas with low tree coverage? Which thoroughfares that people commute along every day have no shade?
And it also helps Rachel do what she has focused her career on: creating community-led programs. After more than a decade of working at nonprofits, she’s learned that resilient communities are connected communities.
“This data helps us go beyond assumptions and see where the actual need is,” Rachel says. “And it frees me up to focus on what I know best: listening to the people of LA, local policy and urban forestry.”
After working with Google on Tree Canopy Lab, she’s found that data gives her a chance to connect with the public. She now has a tool that quickly pools together data and creates a visual to show community leaders what’s happening in specific neighborhoods, what the city is doing and why it’s important. She can also demonstrate ways communities can better manage resources they already have to achieve local goals. And that’s something she thinks every city can benefit from.
“My entrance into urban forestry was through the lens of social justice and economic inequity. For me, it’s about improving the quality of life for Angelenos,” Rachel says. “I’m excited to work with others to create that impact on a bigger level, and build toward the potential for a better environment in the future.”
And in this case, building a better future starts with one well planned tree at a time.
How we’re supporting climate action in European cities
by Rowan Barnett on Oct.02, 2020, under 3D Models, Argentina, Australia, Brazil, California, Denmark, England, Germany, Google Earth, Google Earth News, Google Earth Tips, Google Sky, Google maps, Hawaii, Indonesia, Ireland, Italy, Japan, Kenya, Mexico, Natural Landmarks, Netherlands, Sightseeing, Street Views, USA
Climate action can have the biggest impact in cities, which are responsible for 70 percent of the world's CO₂ emissions. That’s why we committed to helping more than 500 cities reduce 1 gigaton of carbon emissions annually by 2030 as part of our ambitious plan for climate action. To help reach that goal, ICLEI-Local Governments for Sustainability, with grant support from Google.org, is funding six projects. The projects will use actionable data to test new strategies that can reduce emissions and improve air quality in cities across Europe.
ICLEI is a global network of more than 1,750 local and regional governments committed to sustainable urban development. Last fall, we granted $4 million in funding to them to establish the ICLEI Action Fund and support nonprofits and academic institutions in Europe and Latin America that are leading data-driven climate action efforts. Here’s a look at the projects that have been funded and what we’ve learned so far.
Projects selected for funding across Europe
The Centre for Sustainable Energy plans to establish an open-source, city-wide energy dataset in Birmingham, England. The team will also develop analysis tools that can model decarbonisation options for buildings in the city, overlay and integrate public datasets, and aggregate granular socioeconomic data.
With these tools, the Centre hopes to develop city-wide interventions and smaller community initiatives that will help the city reach its overall decarbonisation goals. “By combining emissions data for buildings, transport, and energy infrastructure with socioeconomic data, and distributing local community grants, we’ll be able to help residents deliver targeted carbon reduction projects, and support the City Council and Route to Zero Task Force to deliver their city-wide climate emergency ambitions,” said Rachel Coxcoon, Programme Director at the Centre for Sustainable Energy.
In Hamburg, the CityScienceLab of the HafenCity University will develop a tool incorporating data from Google’s Environmental Insights Explorer (EIE), Hamburg’s urban data platform and other sources. With this tool, they plan to help the city identify areas that can be used as “urban testbeds” for prototyping energy innovations in the Altona, Norg and Bergedorf districts. The prototyping process will help visualise and simulate projects to better understand their projected impact on the city.
Other Action Fund grantees and their projects include:
- Deutsche Umwelthilfe in Berlin: To help the city reach its air quality and carbon-free transport goals, they plan to analyze data about air quality, noise levels and traffic, and use EIE to advocate for data-driven changes to cycling and other transportation infrastructure.
- Carbon Co-Op in Greater Manchester: Working with local partners, they'll develop multi-sector energy plans for the regions and pilot three citizen-led projects focused on sustainable mobility and energy-efficient buildings. A newly developed urban energy dashboard will help them track impact.
- Miljopunkt Amager in Copenhagen: Using Google Air View, traffic data and community-collected data, they’ll test new urban space designs that may improve air quality.
- Air Pays de la Loire in Nantes: Using real-time air quality datasets that account for traffic conditions, they will provide citizens and local authorities with tools to make decisions about transportation management and traffic regulation systems.
The latest insights from cities taking data-driven climate action
Through these projects, we’ve seen how cities are thinking about data-backed sustainability planning and action. So far, we’ve seen trends that can be applied globally.
First, starting small can lead to a big impact—especially when it comes to data. City-level data can point decision-makers in the right direction, while neighborhood or district data can create the necessary community buy-in for more specific programs or interventions. Second, actionable data can help citizens make informed day-to-day decisions and take action. After all, informed citizens are a critical piece of the puzzle. Last, we saw a huge interest in cities looking to improve air quality through more efficient and low-carbon transportation options.
To have a meaningful impact on climate change, data-driven approaches must be scaled across the globe. That’s why Google.org provided ICLEI’s Global Secretariat with additional funding to develop case studies so they can share best practices that emerge from the Action Fund with cities around the world that are looking to implement similar data-driven climate interventions.
One of our goals at Google is to unlock climate ambitions with data, insights, and innovation to overcome today’s climate crisis. We’re excited to continue supporting leading organizations, such as ICLEI, and cities that share that goal.
Image Credit: Google Earth image of Paris, France 2019, Aerodata International Surveys, Maxar Technologies, The GeoInformation Group | InterAtlas
Cities: where climate action can have the most impact
by Rebecca Moore on Sep.14, 2020, under 3D Models, Argentina, Australia, Brazil, California, Denmark, England, Germany, Google Earth, Google Earth News, Google Earth Tips, Google Sky, Google maps, Hawaii, Indonesia, Ireland, Italy, Japan, Kenya, Mexico, Natural Landmarks, Netherlands, Sightseeing, Street Views, USA
Cities bring people and ideas together. They increase living standards, spur innovation, increase opportunity, and encourage collaboration. Cities can also be the most environmentally sustainable way for people to inhabit our planet, if we can address the reality that cities are currently responsible for 70 percent of the world’s CO₂ emissions. While this may seem like an insurmountable challenge, it’s actually a tremendous opportunity. Cities can become centers of climate action, and lead the world in driving economic recovery and resilience.
As part of Google's most ambitious decade of climate action, we’re making a commitment to help more than 500 cities and local governments reduce an aggregate of 1 gigaton (that’s one billion tons) of carbon emissions per year by 2030 and beyond.
To do this, we'll empower city planners and policymakers with the Environmental Insights Explorer (EIE), a platform we developed by analyzing Google’s comprehensive global mapping data together with standard greenhouse gas (GHG) emission factors. Today, we’re expanding access to EIE, going from 122 cities with access to more than 3,000 cities worldwide—a 25-fold increase. We’re also partnering with leading organizations, like ICLEI and Ironbark Sustainability, to support local climate action planning.

Turning climate insights into action
For cities to make a meaningful impact in reducing their carbon emissions tomorrow, they need to know where they stand today.
Yet according to the Global Covenant of Mayors, an international alliance of nearly 10,000 cities and local governments committed to fighting climate change, less than 20 percent of cities are able to execute on their commitments to climate action due to a lack of time, resources and data. And with COVID-19 leaving many localities with reduced budgets and limited resources, it’s even harder to build out a baseline emissions inventory or a robust climate plan.
With Environmental Insights Explorer, cities can leapfrog the constraints associated with lengthy climate studies. Cities can use EIE’s anonymized, aggregated mapping data and emissions insights to easily estimate the carbon footprint of their buildings and transportation activities, as well as discover their solar energy potential. Information that once required complicated onsite measurements and months to compile can now be assessed virtually, helping cities dedicate their energies toward action.
Cultivating partnerships with climate action leaders and cities worldwide
When it comes to climate change, we all need to work together. Nonprofits, businesses, universities and other leaders play an important role in testing new ideas and partnering with cities to implement the ones that work.
We’ve collaborated with partners to scale data access. Leading organizations like Local Governments for Sustainability (ICLEI ) and Ironbark Sustainability are integrating EIE data into their own tools, helping digitize emissions measurement and planning. With EIE data, Ironbark Sustainability is automating how they provide greenhouse gas emission information to local government councils across Australia so decision-makers can target their climate action activities.
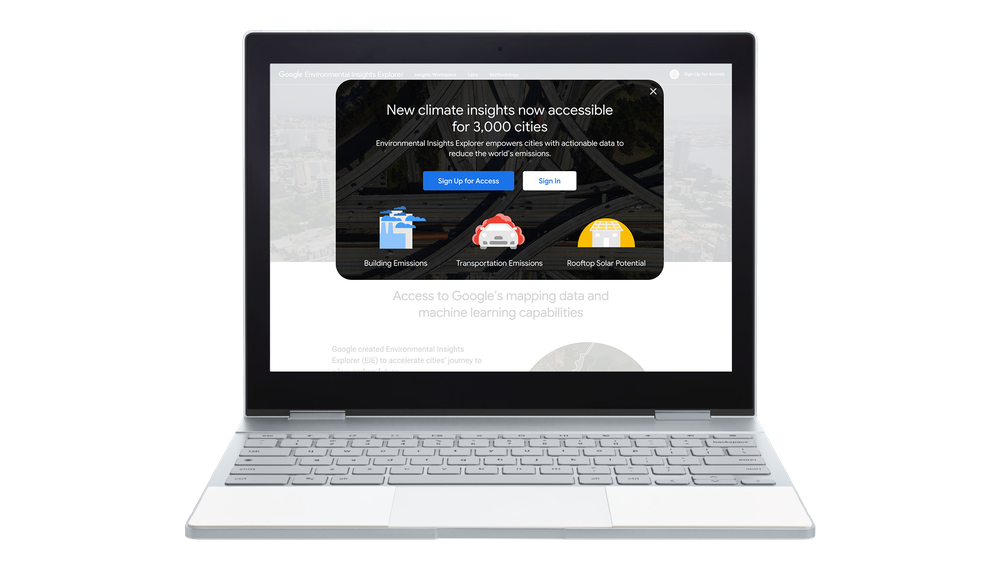
With the Insights Workspace dashboard in EIE, cities can review and evaluate emissions data. Data for more than 3,000 cities is freely available by registering for access at http://goo.gle/eie.
To help spark even more data-driven climate action, last year Google.org committed $4 million in funding to ICLEI Local Governments for Sustainability to create the ICLEI Action Fund. The fund awards projects from local organizations in Europe, Mexico and South America focused on using environmental datasets to reduce citywide emissions.
Today, ICLEI is announcing the first two selected projects. In Hamburg, HafenCity University is creating a tool to help the city identify spaces and districts that can be used as urban testbeds for prototyping sustainable mobility, building efficiency and solar energy development projects. In Monterrey, Mexico, Instituto Tecnológico de Monterrey received a grant to refine and amplify EIE data to help municipalities in the Monterrey region develop climate action plans. They’ll also use the data to run a model of traffic patterns in Monterrey to assess the electrification of a fleet of buses and how to optimize transit routes.
Supporting economic recovery and resilience with climate action
Efforts to combat climate change are both essential and a once-in-a-generation moment to create impactful jobs and modernize infrastructure. As communities are working to combat, and recover from, a global pandemic, reducing carbon emissions can and should support that recovery.
Already, cities and local governments across the world are using EIE to set bold climate action plans and support economic development:
The opportunity in front of us all
We’ve always viewed challenges as opportunities to be helpful and make things better for everyone. To build a better future and protect our planet, we’ll continue focused efforts that help our partners take climate action and strengthen investments in technologies to make a carbon-free world a reality.
Explore new sites, relive old hikes for National Park Week
by Molly on Apr.22, 2020, under 3D Models, Argentina, Australia, Brazil, California, Denmark, England, Germany, Google Earth, Google Earth News, Google Earth Tips, Google Sky, Google maps, Hawaii, Indonesia, Ireland, Italy, Japan, Kenya, Mexico, Natural Landmarks, Netherlands, Sightseeing, Street Views, USA
Every year, I try to visit a new National Park, or at least start planning my trip to one. That’s a little more difficult right now, but given that it’s National Park Week, I decided to try and keep with my tradition by using Google tools to satisfy my wanderlust.
Explore new places and parks
This year, I’m heading to g.co/nationalparks, a Google Arts & Culture project developed in collaboration with National Park Service that takes you on guided tours narrated by park rangers from the Kenai Fjords, Hawai'i Volcanoes, Carlsbad Caverns, Bryce Canyon and Dry Tortugas. I can also visit historical sites that I’ve never been to before, like Eleanor Roosevelt’s woodsy home in Hyde Park, New York or Thomas Edison’s camping sites (which, to me, look a little more like glamping). There are more than 100 Street View historical tours to choose from, and collections that let you discover Native American craft work or fossils from archeological digs.
Afterward, I’ll take an in-depth tour of some of the National Parks of the United States and wander through a few of the most-loved ones recommended by our community of Local Guides in two popular Google Earth Voyager stories. I plan on rounding out the week with a new YouTube series from the Google Earth team that travels to National Parks across the country, literally “zooming” you into places like Elephant Hill in Canyonlands National Park and Kanarraville Falls in Zion National Park. There’s even a new Global National Parks quiz to test your geo-knowledge.

All of these things help an outdoor enthusiast who’s stuck inside (for the time being) to find unknown landscapes or get inspiration for their next trip. Perhaps for the most well-traveled out there, they’re a way to remember a favorite adventure.
Or revisit old favorites
Before I venture into the unknown, I decided to take a trip down memory lane (or rather, memory trail), and re-experience some of my favorite hikes in National Parks with the help of Google Street View, and anyone can join me—starting with Bright Angel Trail in the Grand Canyon. Saving the uphill journey for the second half of a hike is something my legs will never forget, but it remains one of my favorite National Parks memories. And thanks to Street View, I can recreate the journey … with fewer water breaks, probably.
I can also make my way up Garfield Peak in Crater Lake National Park (which I hiked during a camping trip where I first met my husband) and make as many nostalgic pit stops along the way as I want.
And last summer, my family and I all vacationed in Acadia National Park. Now that we can’t physically see one another, I’m even more grateful we went. One of my favorite memories was hiking along the park’s easternmost edge, the Great Head Trail, with my husband and meeting my family on Sand Beach, a journey I’m happily retaking via Street View … and maybe on our weekly family video call, we’ll all “hike” it together.
Explore new sites, relive old hikes for National Park Week
by Molly on Apr.22, 2020, under 3D Models, Argentina, Australia, Brazil, California, Denmark, England, Germany, Google Earth, Google Earth News, Google Earth Tips, Google Sky, Google maps, Hawaii, Indonesia, Ireland, Italy, Japan, Kenya, Mexico, Natural Landmarks, Netherlands, Sightseeing, Street Views, USA
Every year, I try to visit a new National Park, or at least start planning my trip to one. That’s a little more difficult right now, but given that it’s National Park Week, I decided to try and keep with my tradition by using Google tools to satisfy my wanderlust.
Explore new places and parks
This year, I’m heading to g.co/nationalparks, a Google Arts & Culture project developed in collaboration with National Park Service that takes you on guided tours narrated by park rangers from the Kenai Fjords, Hawai'i Volcanoes, Carlsbad Caverns, Bryce Canyon and Dry Tortugas. I can also visit historical sites that I’ve never been to before, like Eleanor Roosevelt’s woodsy home in Hyde Park, New York or Thomas Edison’s camping sites (which, to me, look a little more like glamping). There are more than 100 Street View historical tours to choose from, and collections that let you discover Native American craft work or fossils from archeological digs.
Afterward, I’ll take an in-depth tour of some of the National Parks of the United States and wander through a few of the most-loved ones recommended by our community of Local Guides in two popular Google Earth Voyager stories. I plan on rounding out the week with a new YouTube series from the Google Earth team that travels to National Parks across the country, literally “zooming” you into places like Elephant Hill in Canyonlands National Park and Kanarraville Falls in Zion National Park. There’s even a new Global National Parks quiz to test your geo-knowledge.
All of these things help an outdoor enthusiast who’s stuck inside (for the time being) to find unknown landscapes or get inspiration for their next trip. Perhaps for the most well-traveled out there, they’re a way to remember a favorite adventure.
Or revisit old favorites
Before I venture into the unknown, I decided to take a trip down memory lane (or rather, memory trail), and re-experience some of my favorite hikes in National Parks with the help of Google Street View, and anyone can join me—starting with Bright Angel Trail in the Grand Canyon. Saving the uphill journey for the second half of a hike is something my legs will never forget, but it remains one of my favorite National Parks memories. And thanks to Street View, I can recreate the journey … with fewer water breaks, probably.
I can also make my way up Garfield Peak in Crater Lake National Park (which I hiked during a camping trip where I first met my husband) and make as many nostalgic pit stops along the way as I want.
And last summer, my family and I all vacationed in Acadia National Park. Now that we can’t physically see one another, I’m even more grateful we went. One of my favorite memories was hiking along the park’s easternmost edge, the Great Head Trail, with my husband and meeting my family on Sand Beach, a journey I’m happily retaking via Street View … and maybe on our weekly family video call, we’ll all “hike” it together.
How we power climate insights and action
by Rebecca Moore on Dec.10, 2019, under 3D Models, Argentina, Australia, Brazil, California, Denmark, England, Germany, Google Earth, Google Earth News, Google Earth Tips, Google Sky, Google maps, Hawaii, Indonesia, Ireland, Italy, Japan, Kenya, Mexico, Natural Landmarks, Netherlands, Sightseeing, Street Views, USA
This week, governments and NGOs from across the globe are convening at COP25, the United Nations climate conference in Madrid, to discuss the latest efforts to fight climate change. Addressing this pressing issue on a global scale requires urgent action from countries, communities and businesses. At COP25 we shared how Google is focused on building sustainability into everything that we do and making it possible for everyone to build a more sustainable world.
As cities now account for more than 70 percent of global emissions, we believe that empowering city governments with comprehensive, climate-relevant data and technology can play a critical role in igniting action.
One way we are doing this is with partners like the Global Covenant of Mayors for Climate and Energy. We’ve brought our online tool, the Environmental Insights Explorer (EIE),to cities across the world, providing high-resolution data to measure greenhouse gas emissions (GHG) and take informed action to reduce CO2 emissions. As of today, EIE has now expanded to more than 100 cities worldwide.

Empowering local action in cities worldwide
As we look beyond our latest efforts to equip cities with more comprehensive data, we’re also exploring how we can help communities turn these insights into action at the local level.
To further accelerate climate action, Google.org is launching a new $4 million fund in collaboration with ICLEI - Local Governments for Sustainability.Grants from the fund will support nonprofits and academic institutions in Europe and Latin America that are leading data-driven climate action efforts.
The first grantee is Iniciativa Climática de México (ICM), a Mexico-based nonprofit organization that catalyzes international climate policy at the national and city levels to reduce emissions of GHGs and promotes low carbon growth in Mexico. Grant funds will be allocated to their “Hogar Solar” program. This program channels government spending on electricity towards the installation of solar panels to help increase access to power for those facing energy poverty, provide cleaner energy sources and reduce overall electricity costs.
Data-driven initiatives like this are essential to addressing climate change and are needed at a global scale. As we fund more grantees, we will share what we learn on how to best engage in data-backed sustainability planning and action.
Translating global insights
EIE relies on anonymous, highly aggregated mapping data and standard GHG emission factors to estimate city building and transportation carbon emissions, as well as solar energy potential. We’re already seeing the early impacts of cities putting the power of EIE data behind climate plans, from bike-friendly initiatives to solar programs.
While EIE has officially published data for 100 cities, the EIE team has processed climate-relevant data across an initial sample of 3,000 cities to produce emission insights from approximately 95 million buildings and nearly 3 trillion kilometers traveled.
Our analysis found that cities can have a huge impact in protecting our climate:
Making environmental information available will continue to be critical as cities, communities and companies worldwide band together to address climate change. We’re committed to doing our part, and want to extend our thanks to the forward-looking city officials and climate leaders collaborating with us on this project.
If you’d like to request EIE data for your city, let us know. And learn more about Google’s other sustainable efforts at sustainability.google.
Real-time bikeshare information in Google Maps rolls out to 24 cities
by Andrew Hyatt on Jul.17, 2019, under 3D Models, Argentina, Australia, Brazil, California, Denmark, England, Germany, Google Earth News, Google Earth Tips, Google Sky, Google maps, Hawaii, Indonesia, Ireland, Italy, Japan, Kenya, Mexico, Natural Landmarks, Netherlands, Sightseeing, Street Views, USA
Bikesharing is booming as this two-wheeled technology transforms how people get from A to B in cities around the planet. With an estimated 1,600 bikeshare systems and more than 18 million shared bikes in urban centers worldwide, bikesharing has gone mainstream. And for good reason--it’s a convenient, affordable, fun and hassle-free way to get around.
For the past year, travellers and commuters in New York City have been using Google Maps to both locate bikesharing stations and see exactly how many bikes are available at a station in real-time. Today, we’re rolling out this feature to a total of 24 cities in 16 countries.
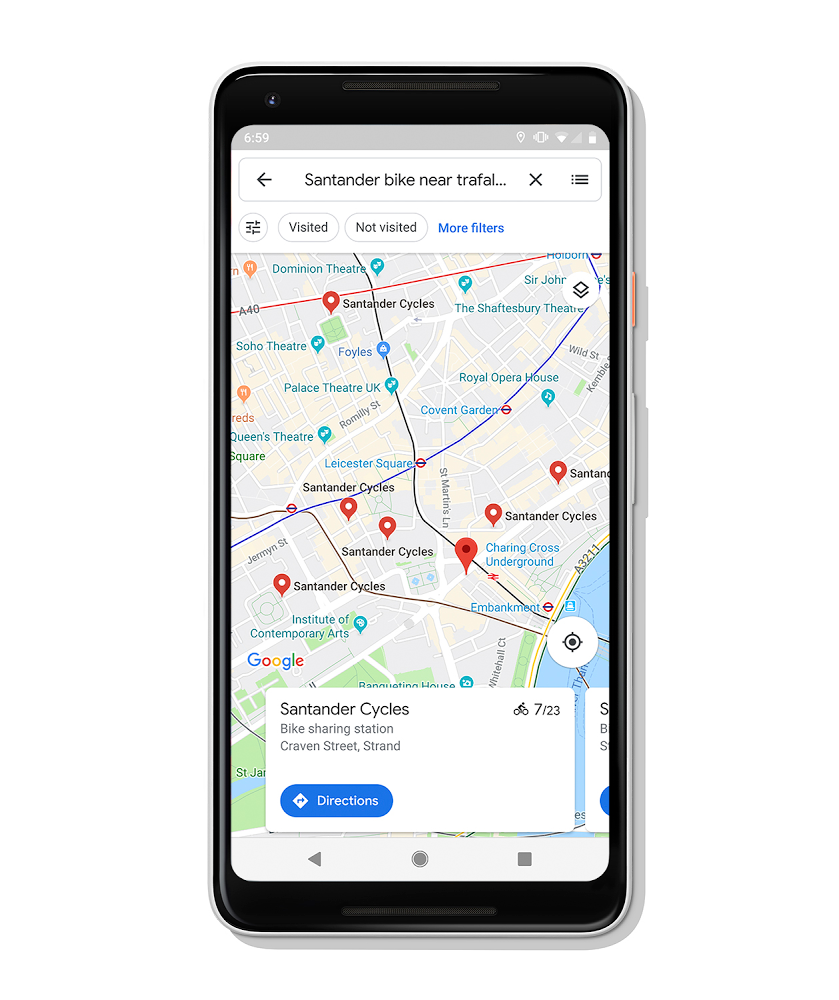
Search for a bikeshare system in Google Maps to see available bikes nearby.
From New Taipei City to Toronto, you can now use Google Maps to locate bikeshare stations and pinpoint how many bikes are available near you. You can also find out whether there’s an empty space at a station near your destination for you to leave your bike. This is all made possible by incorporating a new global bike share data feed directly into Google Maps, thanks to a partnership with Ito World.
Whether you’re traveling in a new city or planning your daily commute, Google Maps is making it easier to weigh all your transportation options with real-time information. Just like how we show you when buses and trains are coming and going in Google Maps, you’ll now know which bikeshare stations have a bike ready for you.
This bird’s eye view into bikesharing is now available in Google Maps on Android and iOS in the following cities globally with more on the way: Barcelona, Berlin, Brussels, Budapest, Chicago, Dublin, Hamburg, Helsinki, Kaohsiung, London, Los Angeles, Lyon, Madrid, Mexico City, Montreal, New Taipei City, New York City, Rio de Janeiro, San Francisco Bay Area, São Paulo, Toronto, Vienna, Warsaw and Zurich.
Transit crowdedness trends from around the world, according to Google Maps
by Taylah Hasaballah on Jun.28, 2019, under 3D Models, Argentina, Australia, Brazil, California, Denmark, England, Germany, Google Earth News, Google Earth Tips, Google Sky, Google maps, Hawaii, Indonesia, Ireland, Italy, Japan, Kenya, Mexico, Natural Landmarks, Netherlands, Sightseeing, Street Views, USA
Crowdedness predictions come from optional feedback directly from the people who use Google Maps. In fact, you may have received notifications asking about how crowded your subway, train, or bus ride was after navigating in transit mode. To learn more about how crowdedness levels vary around the world, we analyzed aggregated and anonymized reports of crowdedness from Google Maps users from October 2018 to June 2019 during peak commuting hours (6am - 10am), and identified which lines had the highest number of crowdedness reports. Here’s what we found:
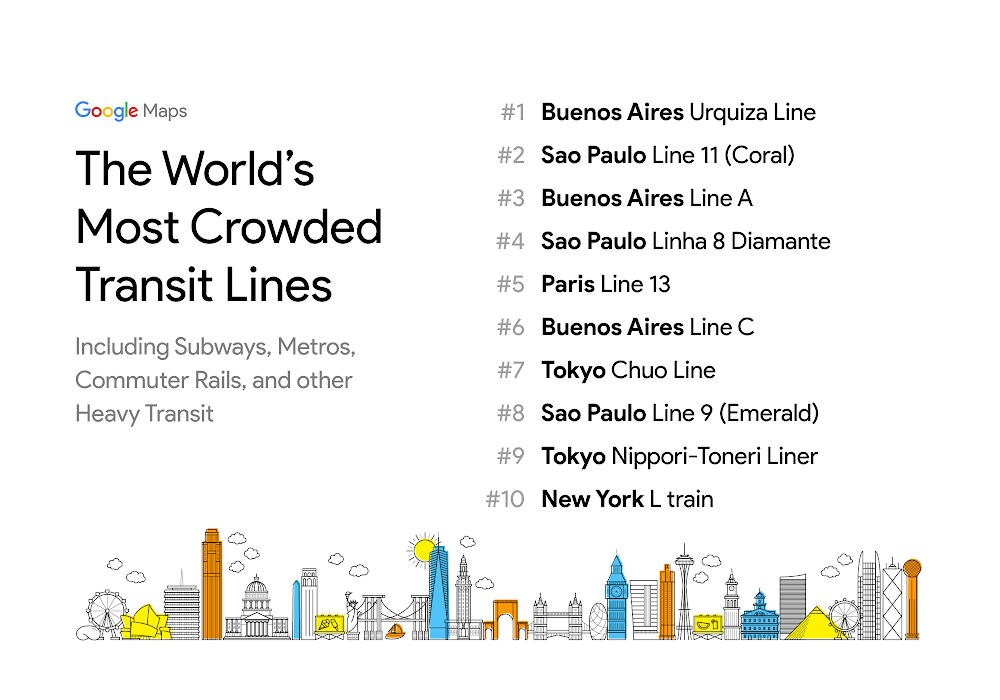
When it comes to the most-crowded transit lines, Buenos Aires and Sao Paulo dominate the rankings–each city has 3 lines in the top 10.
New York’s famed L train–which, until recently, was on the verge of closing for repair– is the only U.S. transit line to make it into the top 10.
Among many U.S. cities, the most-crowded public transit routes are buses. In Los Angeles, for example, bus routes 152, 105, and 704 are among the most-crowded.
Working to map the air everywhere and help #BeatAirPollution
by Karin Tuxen-Bettman on Jun.05, 2019, under 3D Models, Argentina, Australia, Brazil, California, Denmark, England, Germany, Google Earth News, Google Earth Tips, Google Sky, Google maps, Hawaii, Indonesia, Ireland, Italy, Japan, Kenya, Mexico, Natural Landmarks, Netherlands, Sightseeing, Street Views, USA
Whenever I go for a bike ride, I use Google Maps to find bike lanes and avoid busy streets. When I take my kids to the park, I check the weather forecast so I know what to expect. Imagine if we could also see maps of air quality in our neighborhoods, and route ourselves around the pollution for cleaner, healthier bike rides or park visits. What if every city in the world had “hyperlocal” air pollution information so that urban planners could pinpoint hotspots on maps and work to fix air quality problems?
This goal is a good one to reflect on today for World Environment Day. This year’s theme raises awareness for air pollution, encouraging people everywhere to take action to #BeatAirPollution. Doing so will require a lot of effort from businesses, utilities, governments, scientists and everyday citizens.
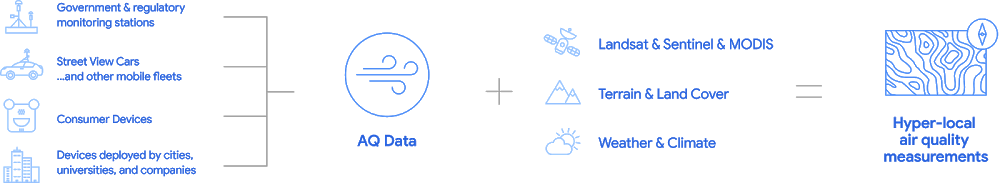
Project Air View is our commitment toward this goal: It’s Google’s effort to help map air pollution in every city in the world and give people and organizations accurate and reliable high-resolution maps of air quality. After our partners at the Environmental Defense Fund (EDF) first proposed the idea in 2012, we equipped Google Street View cars with air pollution sensors—starting with measuring greenhouse gas methane (with EDF), and expanding to measure particulate matter, ozone, nitrogen dioxide and more (with Aclima and EDF).
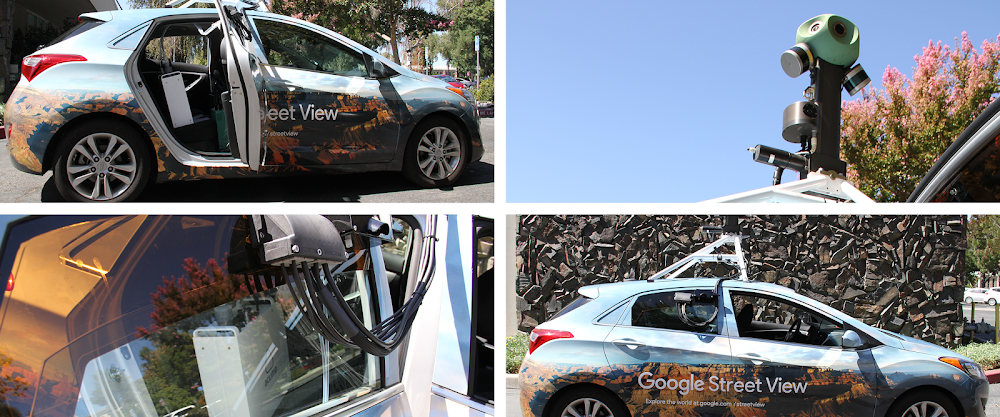
Street View cars equipped with Aclima air quality sensors
Today scientists are starting to merge street-level air quality data with contextual data like satellite imagery, weather data, and government monitoring station data. New satellite sensors, like TROPOMI on the European Space Agency’s Sentinel 5p, are delivering daily pictures of air pollution for the entire globe. You can find this air quality satellite data in Google Earth Engine, along with weather data, atmospheric data and a lot of other Earth observation data (30 petabytes worth!).
Animation showing nitrogen dioxide (NO2) in California and Nevada
for the time period August 27 to September 6, 2018.
Fusing this satellite data with ground-level air quality is made easier by putting environmental data in the cloud. Air quality data collected with Street View cars is served up to researchers via Google Cloud BigQuery, where they can query the tens of millions of records in a matter of seconds. You can also find government monitoring station data published by EPA and OpenAQ in BigQuery through the Google Cloud Public Datasets program.
How Project Air View can help us understand more about ground-level air quality
Air quality is an important issue and can be difficult to map on hyperlocal level, which is why we’ve taken time to make sure we get it right. We’ve made a lot of progress. After launching air quality maps for Oakland, CA with Aclima and EDF, we expanded to other regions of the state. More recently, we have worked with our research partners to add other U.S. cities like Houston and Salt Lake City, as well as Copenhagen, London, and Amsterdam in Europe.
And today, we’re publishing a new batch of air quality data—the measurements we've made with Aclima between 2017 and 2018. Scientists can request access to the data via this form. This new mapping data supplements our previously released hyperlocal air quality data, which includes measurements in the San Francisco Bay Area and the northern San Joaquin Valley. The combined datasets now contain 140,000 miles and 7,000 hours of driving from 2016 through 2018. The data captures over three years of air quality moments and insights, big and small.
What’s next?
By the end of this year, we’ll equip 50 more Street View cars with the mobile-friendly Aclima Mobile Sensor Node, and hit the road in cities in Europe, Asia, Africa and North and South America.We’ll continue using tools like BigQuery and platforms like the Air Quality Data Commons to share this data with researchers whose work helps policymakers, businesses, and utilities make better decisions around air quality in their cities.
In the future, we hope existing fleets of vehicles can be used in cities around the world for air quality measurement. We’re already seeing this happen. EDF and Houston’s Public Health Department worked together to equip a few vehicles in their city fleet with air sensors. EDF and the connected vehicle company, GeoTab, published a report showing how cities can determine if they can do the same. And recently, Aclima and Google Cloud have partnered to make this a reality in partnership with cities and counties across the U.S. and around the world, starting with the County of San Mateo and more than 100 municipalities with over 10 million people in California through next year.
Research like this can spread awareness about air pollution, drive new science, and help people take action. If cities around the world join in the effort to measure air pollution, it will be one giant step toward achieving the lofty goal to #BeatAirPollution.
Get lost in the new Earth Timelapse, now on mobile
by Maps on Apr.25, 2019, under 3D Models, Argentina, Australia, Brazil, California, Denmark, England, Germany, Google Earth, Google Earth News, Google Earth Tips, Google Sky, Google maps, Hawaii, Indonesia, Ireland, Italy, Japan, Kenya, Mexico, Natural Landmarks, Netherlands, Sightseeing, Street Views, USA
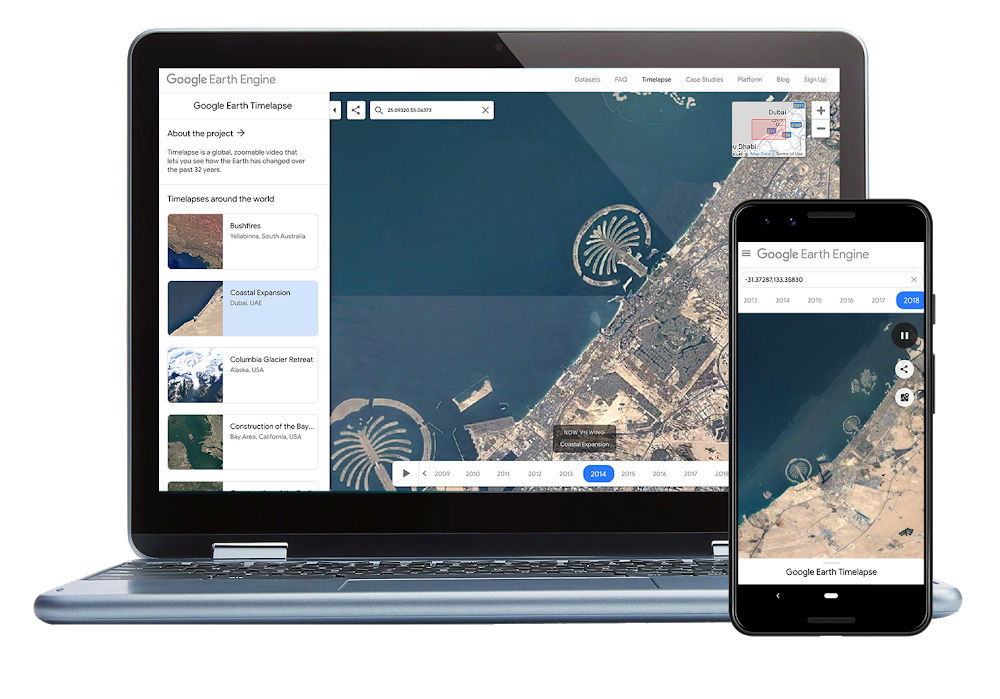
Today we’re introducing several updates to Google Earth Timelapse, a global, zoomable time-lapse video that lets anyone explore the last 35 years of our changing planet’s surface—from the global scale to the local scale. This update adds two additional years of imagery to the time-series visualization, now spanning from 1984 to 2018, along with mobile support and visual upgrades to make exploring more accessible and intuitive.
Timelapse provides a comprehensive picture of our changing Earth—including stunning phenomena like the sprouting of Dubai’s Palm Islands, the retreat of Alaska’s Columbia Glacier and the impressive urban expansion of Las Vegas, Nevada (seen below).
Scientists, documentarians and journalists have used this dataset to help us better understand the complex dynamics at work on our planet. News outlets have brought their reporting to life with Timelapse imagery, from coverage of the floods in Houston, Texas to population monitoring. Recently, a team of scientists at the University of Ottawa published an article Nature based on the Timelapse dataset which revealed a 6,000 percent increase in landslides on a Canadian Arctic island since 1984. Starting this week, if you’re in the U.K., you can see Timelapse imagery featured in Earth From Space, a new BBC series about the incredible discoveries and perspectives captured from above.
Zeit Online uses Timelapse to show the extent to which jungles are cleared for soy production in Brazil.
Using Google Earth Engine, Google's cloud platform for petabyte-scale geospatial analysis, we combined more than 15 million satellite images (roughly 10 quadrillion pixels) to create the 35 global cloud-free images that make up Timelapse. These images come from the U.S. Geological Survey/NASA Landsat and European Sentinel programs. Once again, we joined forces with our friends at Carnegie Mellon’s CREATE Lab, whose Time Machine video technology makes Timelapse interactively explorable.
Today's update also adds mobile and tablet support, making it a little easier for you to explore, research or get lost in the imagery—from wherever you are. Up until recently, mobile browsers disabled the ability to autoplay videos, which is critical for Timelapse (since it’s made up of tens of millions of multi-resolution, overlapping videos). Chrome and Firefox reinstated support for autoplay (with sound muted), so we’ve added mobile support with this latest update.
Earth Timelapse, now available on phones and tablets, includes a handy new "Maps Mode" toggle to let you navigate the map using Google Maps.
The design of the new Timelapse interface leverages Material Design with simple, clean lines and clear focal areas, so you can easily navigate the immense dataset. We contributed this new user interface to the open-source Time Machine project, used by Carnegie Mellon and others. Read more about our design approach at Google Design.
We’re committed to creating products like Timelapse with the planet in mind, and hope that making this data easily accessible will ground debates, encourage discovery, and inform the global community’s thinking about how we live on our planet. Get started with Timelapse on the Earth Engine website, or take a mesmerizing tour of the world through YouTube.